


FIVE YEAR RATE INCREASES, DROPOUT RATE HITS ALL-TIME LOW
Many things have changed over the past year, largely the result of the COVID-19 pandemic, and that includes the graduation rate at Des Moines Public Schools. As the expression goes: there’s some good news and some bad news.
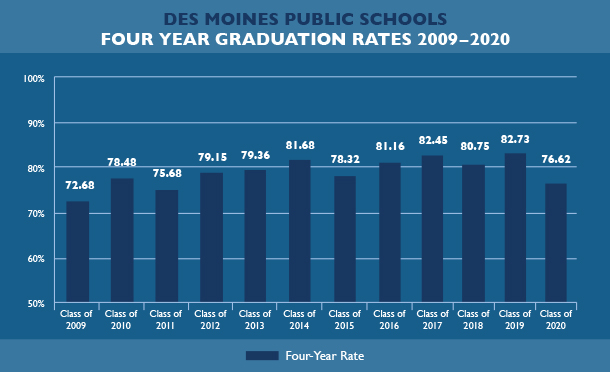
On the one hand, the four-year graduation for the Class of 2020 was 76.62%, the lowest mark in nearly a decade. With a school-year that ended in the middle of last March, some seniors simply weren’t able to finish the requirements needed to earn their diploma last Spring. However, while many did so last summer, nearly 250 of the seniors who came up short last year are still in school today and on their way to being a member of the Class of 2021.
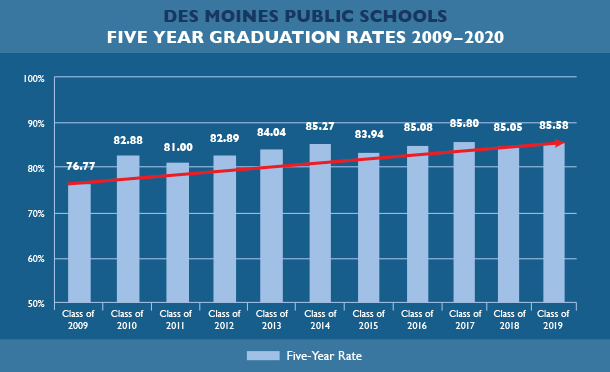
But, there were two very notable bright spots in the numbers. First, the five-year graduation rate went up to 85.58%, the second highest mark in the past ten years. What’s more, the dropout rate at DMPS has hit an all-time low: just 3.38%.
Our data and assessment team has put together an analysis below describing how the figures are calculated along with some of the recent trends in graduation and drop-out rates at DMPS.
GRADUATION RATE
Four-Year Graduation Rate: Iowa’s graduation rate is a cohort calculation. The four-year cohort graduation rate measures the percent of students in a ninth-grade cohort that graduate with a regular diploma in four years or less. The four-year cohort graduation rate is calculated for the class of 2020 by dividing the number of students in the cohort who graduate with a regular high school diploma (numerator) in four years or less by the number of first-time ninth-grade students enrolled in the fall of 2016. As high school students transfer in and out of schools, they are added to or subtracted from the calculation.
 Five-Year Graduation Rate: The methodology for calculating the five-year cohort graduation rate is a process to determine the year five high school outcomes for non-graduates included in the four-year cohort graduation rate from the preceding year (class of 2019). As such, the four- and five-year cohort graduation rates share the same cohort of students in common, all of whom started grade nine at the same time and were expected to graduate on-time four years later. Unlike the four-year cohort, the five-year cohort is not adjusted by adding to subtracting students who transferred in or out of schools during year five. Rather, the five-year cohort is largely held constant in year five to reduce artificial fluctuations in the five-year cohort graduation rate based solely on cohort adjustments to the denominator (transfers in, transfers out, and removals) that are allowed in the four-year rate.
| School Year | Cohort Size | Four-Year Graduates | Four-Year Rate | Five-Year Graduates | Five-Year Rate |
| 2010-11 | 2,011 | 1,522 | 75.68% | 1,629 | 81.00% |
| 2011-12 | 1,923 | 1,522 | 79.15% | 1,594 | 82.89% |
| 2012-13 | 1,923 | 1,526 | 79.36% | 1,616 | 84.04% |
| 2013-14 | 1,960 | 1,601 | 81.68% | 1,673 | 85.27% |
| 2014-15 | 1,937 | 1,517 | 78.32% | 1,626 | 83.94% |
| 2015-16 | 2,065 | 1,676 | 81.16% | 1,757 | 85.08% |
| 2016-17 | 2,120 | 1,748 | 82.45% | 1,819 | 85.80% |
| 2017-18 | 2,228 | 1,799 | 80.75% | 1,895 | 85.05% |
| 2018-19 | 2,247 | 1,859 | 82.73% | 1,922 | 85.58% |
| 2019-20 | 2,348 | 1,799 | 76.62% |
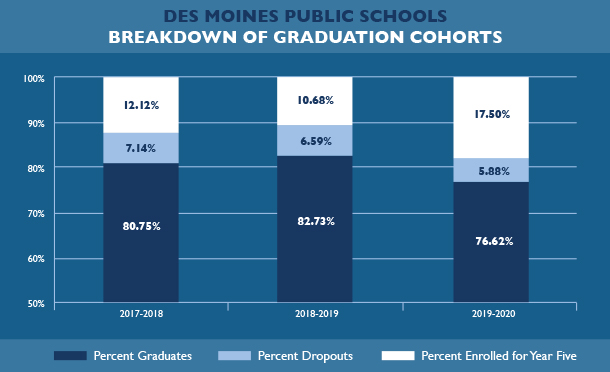
Analysis of 2019-20 four-year graduation rate compared to previous years shows an increase in students remaining enrolled as the source of the decrease in graduation rate. This aligns with the decreased opportunities for in-person credit recovery/attainment due to the pandemic environment.
| School Year | Cohort | Four-Year Graduates | Four-Year Rate | Dropouts | Dropout Rate | Enrolled – Year 5 # | Enrolled – Year 5 % |
| 2017-18 | 2,228 | 1,799 | 80.75% | 159 | 7.14% | 270 | 12.12% |
| 2018-19 | 2,247 | 1,859 | 82.73% | 148 | 6.59% | 240 | 10.68% |
| 2019-20 | 2,348 | 1,799 | 76.62% | 138 | 5.88% | 411 | 17.50% |
Among the 2019-20 non-graduates (dropouts and enrolled for year five), 19 students graduated at the end of semester one of the 2020-21 school year (which will include them as five-year graduates) and 246 students are still enrolled at DMPS high schools as of March 10, 2021. Using trend analysis of five-year graduation rates, it is expected that at least 150 students from the class of 2020 will graduate in year five, resulting in a five-year graduation rate of at least 83 percent.
DROPOUT RATE
The grades 7-12 dropout rate is an annual calculation. The dropout rate is calculated for 2019-20 by dividing the number of students who dropped between certified enrollment count day (October 1, 2019) and the day before certified enrollment count day the following year (September 30, 2020) (and do not return to school within that timeframe) divided by the enrollment as of October 1, 2019.
| School Year | Grades 7-12 Dropouts | Grades 7-12 Dropout Rate |
| 2011-12 | 619 | 4.73% |
| 2012-13 | 551 | 4.16% |
| 2013-14 | 579 | 4.33% |
| 2014-15 | 562 | 4.18% |
| 2015-16 | 626 | 4.57% |
| 2016-17 | 718 | 5.12% |
| 2017-18 | 612 | 4.30% |
| 2018-19 | 553 | 3.84% |
| 2019-20 | 485 | 3.38% |
Annual dropout rates for DMPS are at an all-time low since the state of Iowa started calculating dropout rates from Certified Enrollment count date (October 1) to the day before Certified Enrollment count date (September 30) of the next year. The decrease in DMPS dropouts can be attributed to our multiple modalities for re-engagement/enrollment at the high school level (Virtual Campus, Flex Academy at each high school, and the expansion of Academic Pathways at Kurtz).