


With 31,000 students, Des Moines Public Schools is a reflection not only of our community but, in many ways, of the world. The school district is a dynamic organization that changes over the years.
Dr. Mary Grinstead, the director of data and assessment at DMPS, compiled a look at how the school district has changed over the past two decades. From the race and ethnicity of our students to the services they are provided, DMPS begins 2022 as an evolving and ever-changing organization.
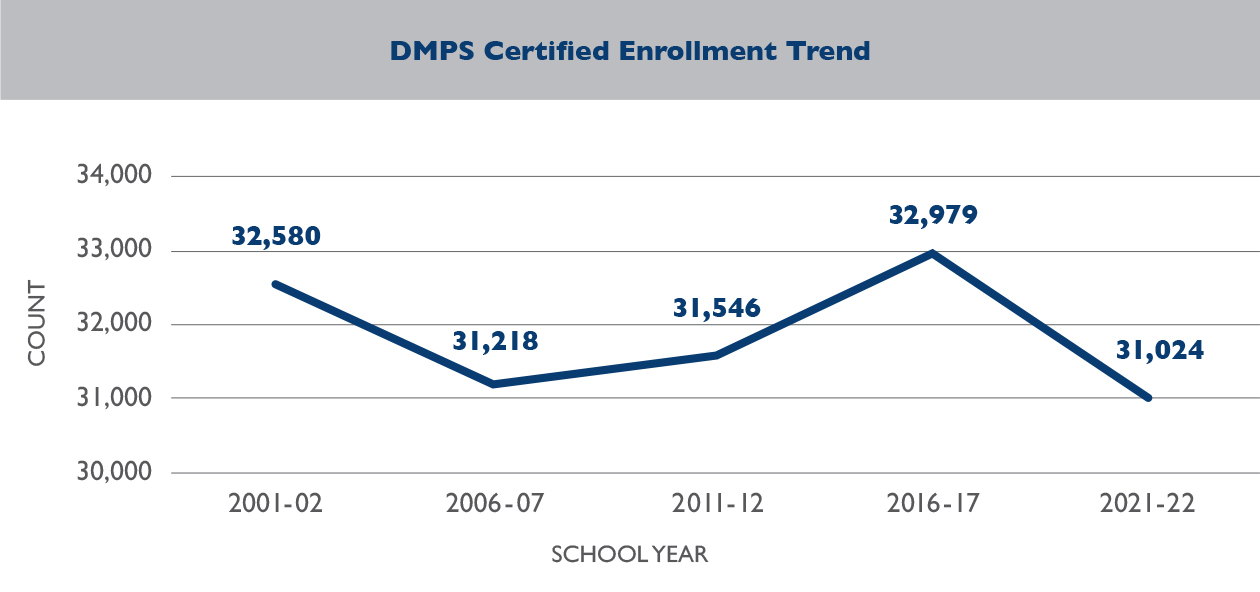
The 2021-22 school year certified enrollment for Des Moines Public Schools (DMPS) is 31,024 students. This is a decrease of 1,556 students from the 2001-02 school year and a decrease of 194 students from the 2006-07 school year. Enrollment has varied between around 31,000 to 33,000 students in the past 20 years.
Race/Ethnicity
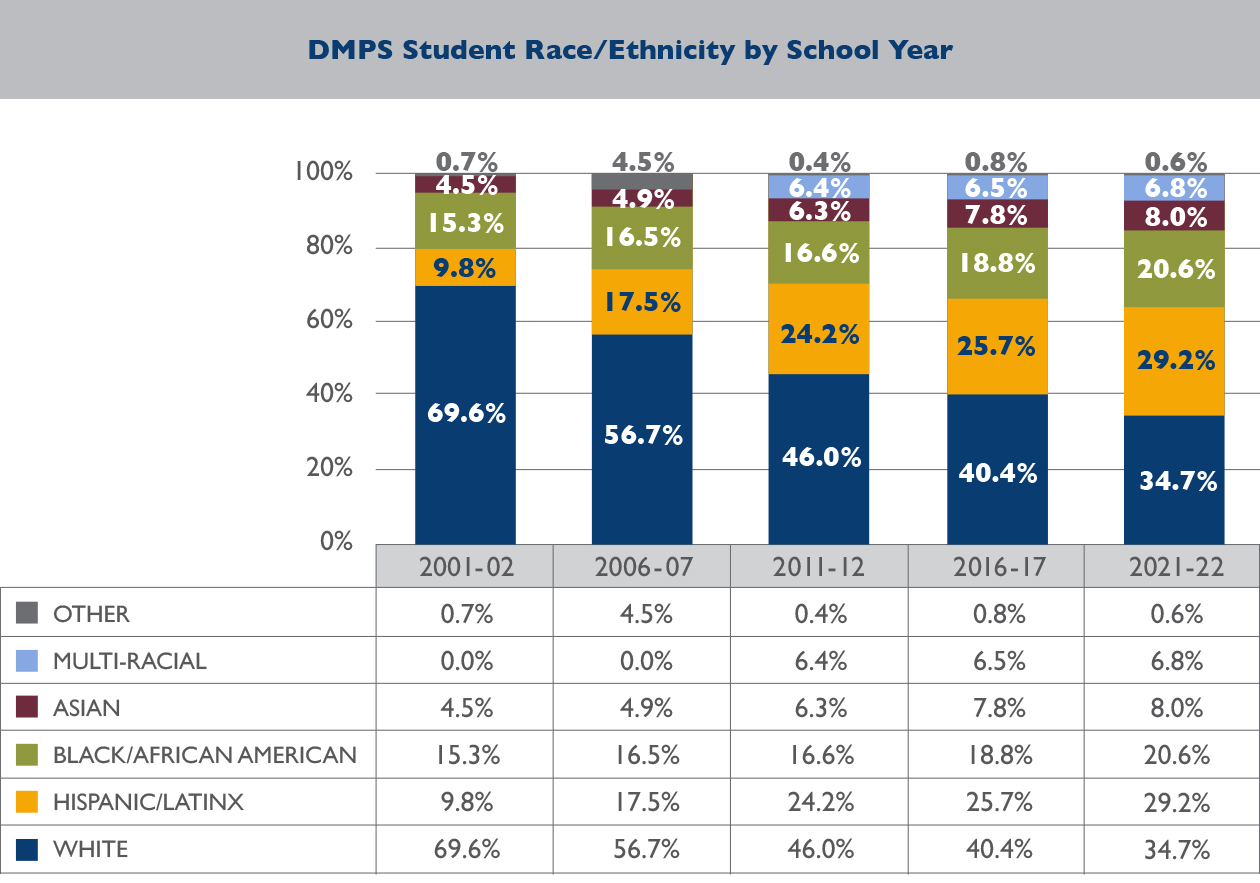
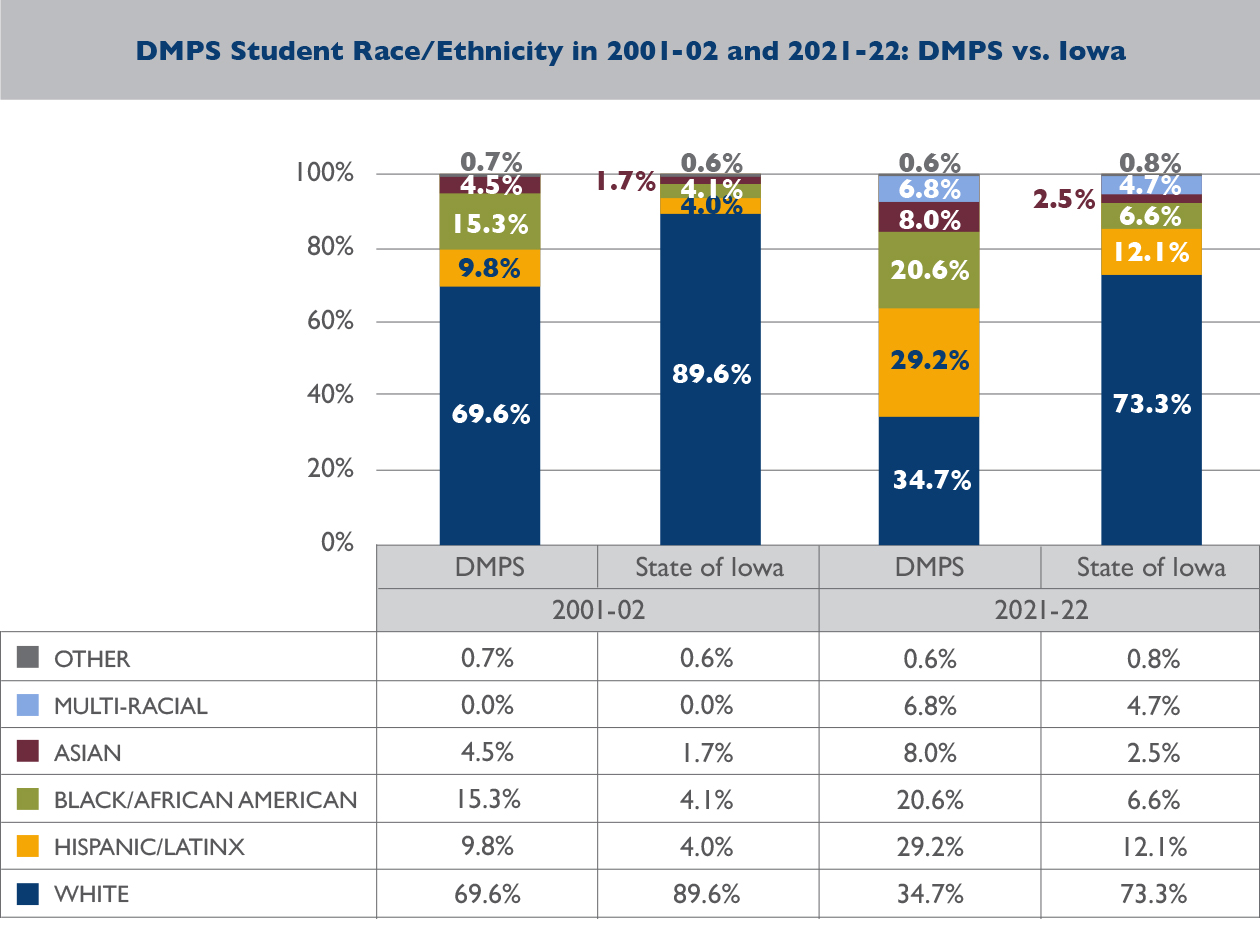
As enrollment has changed, the composition of the student body has also changed. The chart below illustrates ethnic and racial trends from 2001-02 to 2021-22 for DMPS students. In part, the change may be attributed to the way the U.S. Census updated its definition of ethnicity and race in 2009-10. In 2009-10, Hispanic/ Latinx was identified as an ethnicity separate from race. Also, students were able to identify as more than one race starting in the 2009-10 school year. The percent of DMPS student who are non-white has more than doubled in the past 20 years (from 30.4% in 2001-02 to 65.3% in 2021-22).
Eligibility for Services
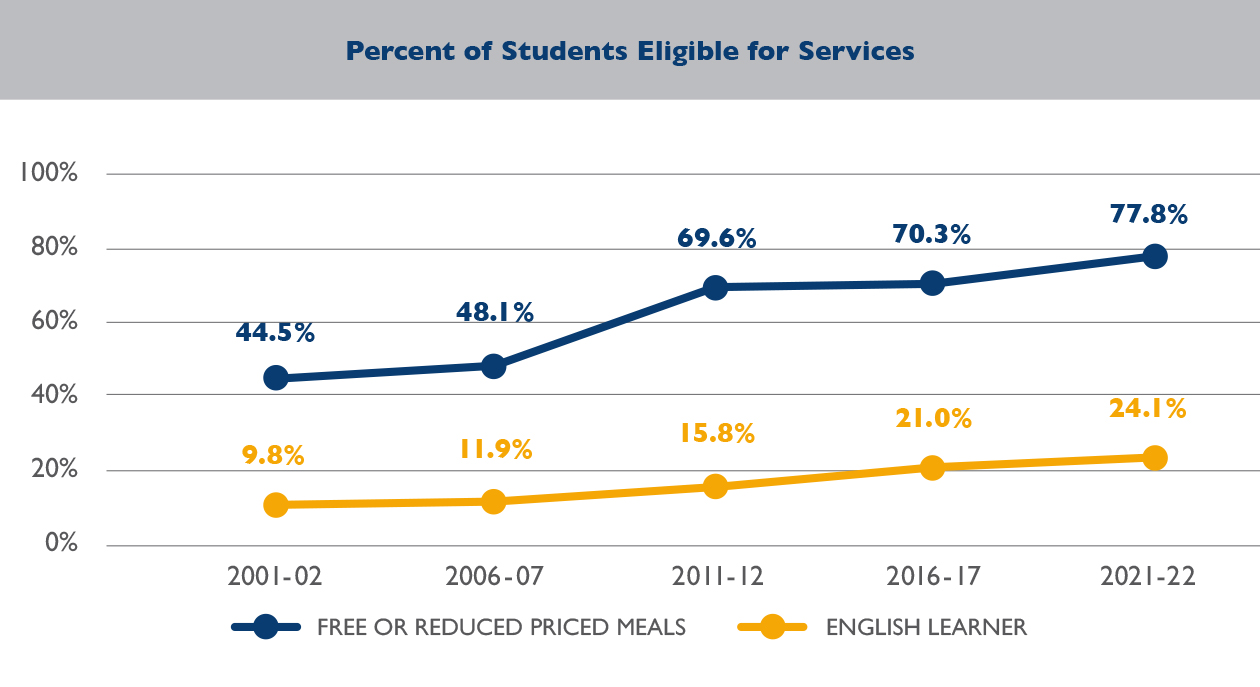
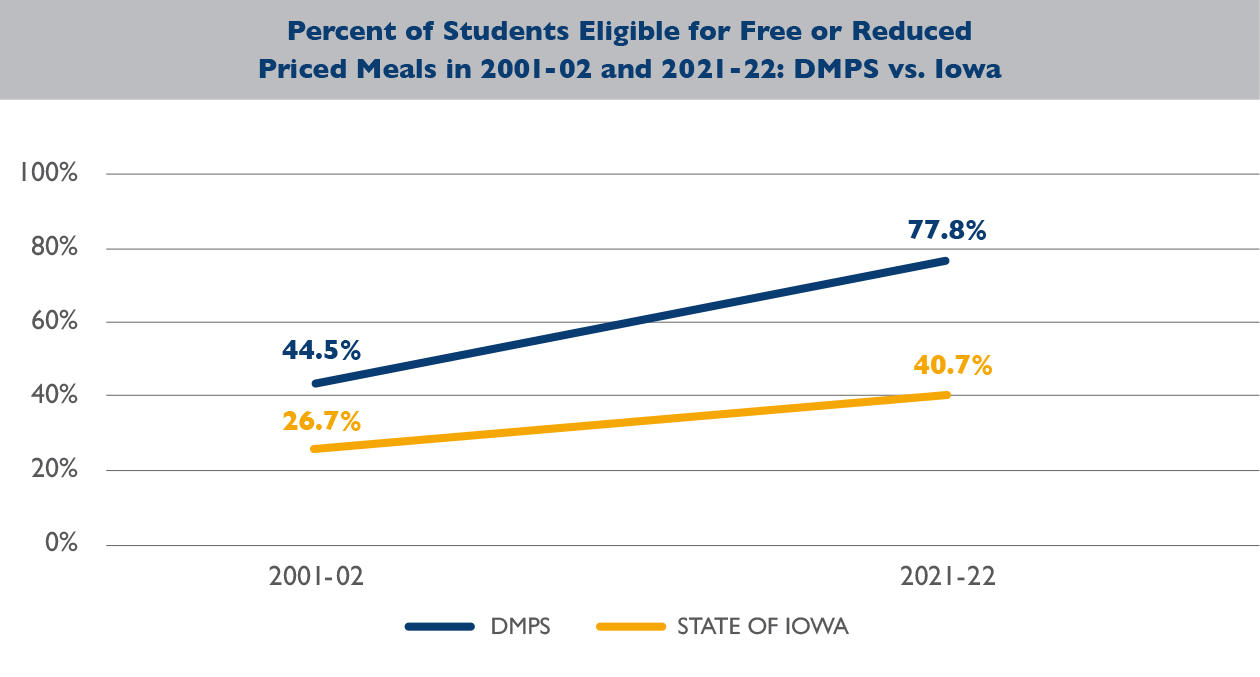
The chart below highlights the changes in K-12 enrollment regarding eligibility for free or reduced-priced meals and English language learner programming. DMPS has experienced an increase of over 30 percentage points of students eligible for free or reduced-priced meals over the past 20 years.
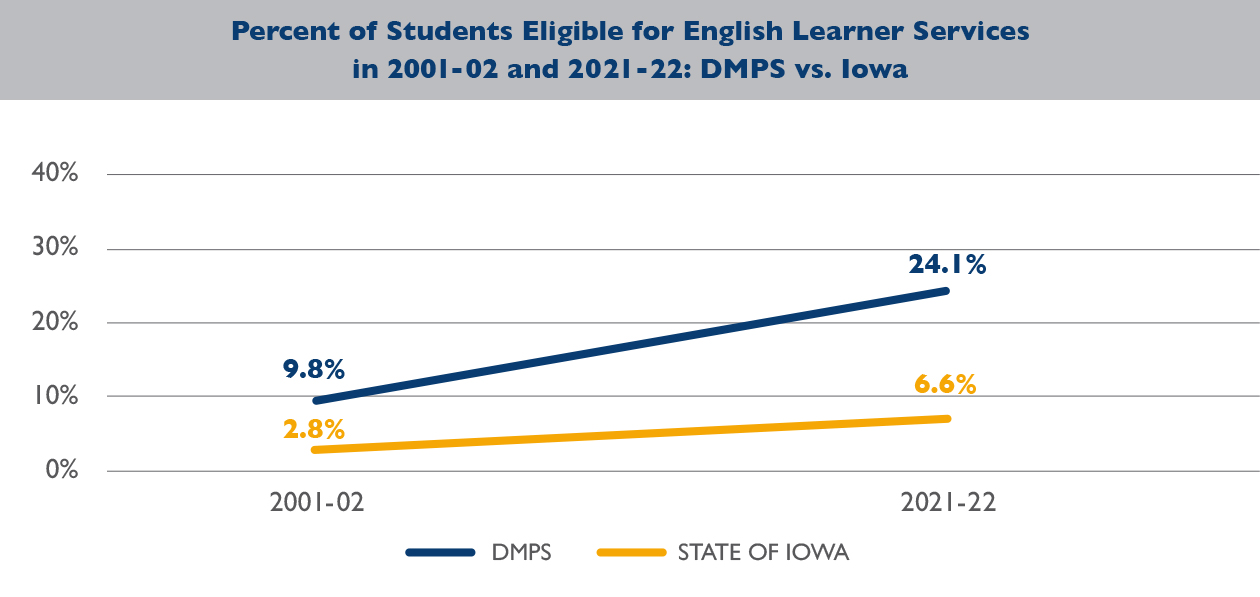
The number of English learner (EL) students has steadily increased at DMPS. In the past 20 years, the EL population at DMPS has almost tripled. Currently, EL students represent 24.1 percent of DMPS students. DMPS educates over 7,000 EL students in grades K-12.
Comparisons with the State of Iowa
Over the past 20 years, student race/ethnicity demographics have changed for both DMPS and the state of Iowa. However, these rates of change have differed drastically. The state of Iowa currently has a higher percentage of white students than DMPS had 20 years ago. In 2001-02, the difference in the percent of white students between the state of Iowa and DMPS was 20. In 2021-22, this difference is 38.6 percentage points. One out of every five Black/African American students attending a public school in Iowa attends DMPS. One out of every seven Hispanic/Latinx students attending a public school in Iowa attends DMPS.
Trends in differences between DMPS and the state of Iowa in percent of students eligible for services, such as free or reduced priced meals and English learners, mirrors trends in percent of students who are non-white. In 2001-02, the difference in percent of students eligible for free or reduced priced meals between the state of Iowa and DMPS was 17.8. In 2021-22, this difference is 37.1 percentage points.
DMPS represents six percent of the state of Iowa’s PK-12 public school student population, yet 12 percent of students eligible for free or reduced priced meals and 22 percent of EL students. DMPS is ranked 9th in the state of Iowa regarding percentage of EL students, with the number of EL students at DMPS being more than the total number students enrolled at 96 percent of Iowa districts.