


Beginning last year, Des Moines Public Schools made a commitment to being an anti-racist organization. From how we teach and learn to the topics covered in our curriculum to the hiring of our teachers and staff, DMPS is working to do better in representing and serving our entire community.
Dr. Mary Grinstead, the director of data and assessment at DMPS, compiled a look at how the school district has changed during the first fifth of the 21st century. From the race and ethnicity of our students to the services they are provided, DMPS enters 2021 as an evolving and ever-changing organization.
On this MLK Day, we share a look at this century’s demographic trends of the students we educate.
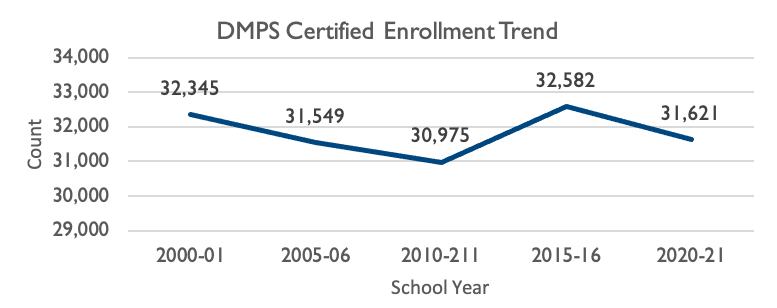
The 2020-21 school year certified enrollment for Des Moines Public Schools (DMPS) is 31,621 students. This is a decrease of 724 students from the 2000-01 school year, but an increase of 646 students from the 2010-11 school year. Enrollment has varied between around 31,000 to 33,000 students over the past 20 years.
RACE/ETHNICITY
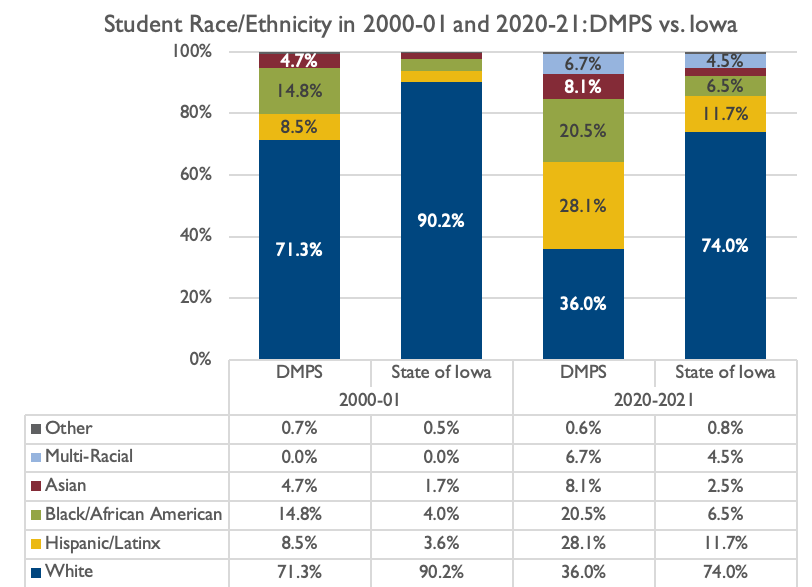
As enrollment has changed, the composition of the student body has also changed. The chart below illustrates ethnic and racial trends from 2000-01 to 2020-21 for DMPS students. 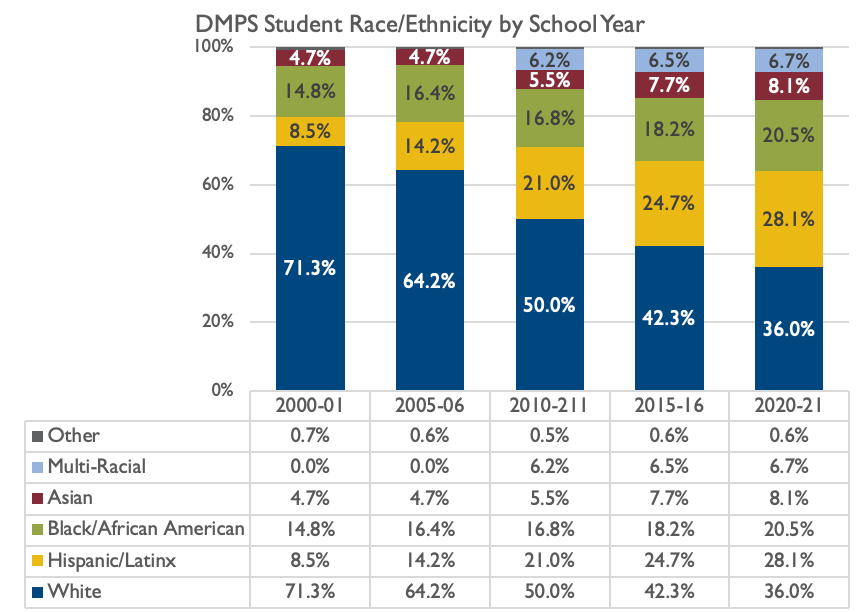
The percent of DMPS students who are non-white has increased by 35 percentage points over the last 20 years.
In part, the change may be attributed to the way the U.S. Census defined ethnicity and race in 2009-10. In 2009-10, Hispanic/ Latinx was identified as an ethnicity separate from race. Also, students we able to identify as more than one race starting in the 2009-10 school year. The percent of DMPS student who are non-white has more than doubled in the past 20 years (from 28.7% in 2000-21 to 64% in 2020-21).
ELIGIBILITY FOR SERVICES
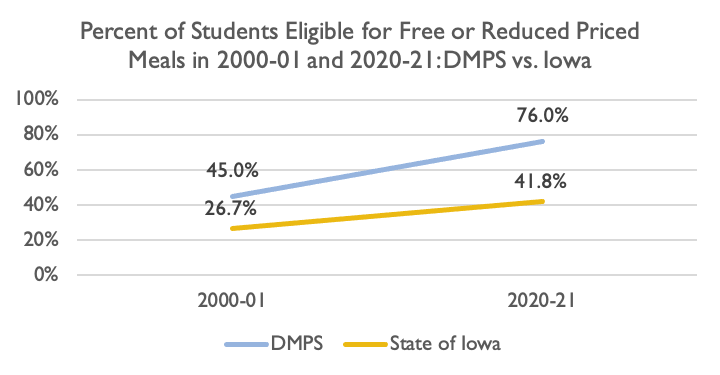
DMPS has experiences an increase of over 30 percent of children eligible for free or reduced priced meals over the past 20 years. The chart below highlights the changes in K-12 enrollment regarding eligibility for free or reduced priced meals and English language learner programming.
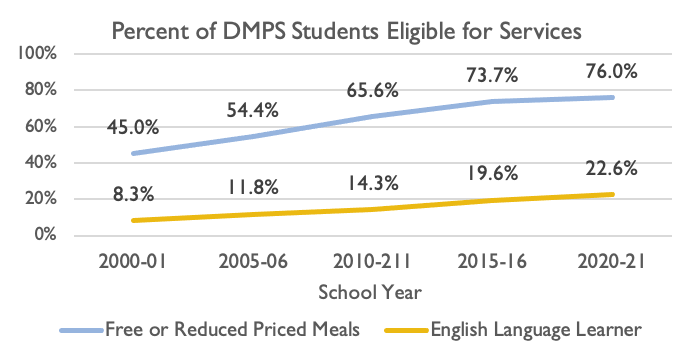
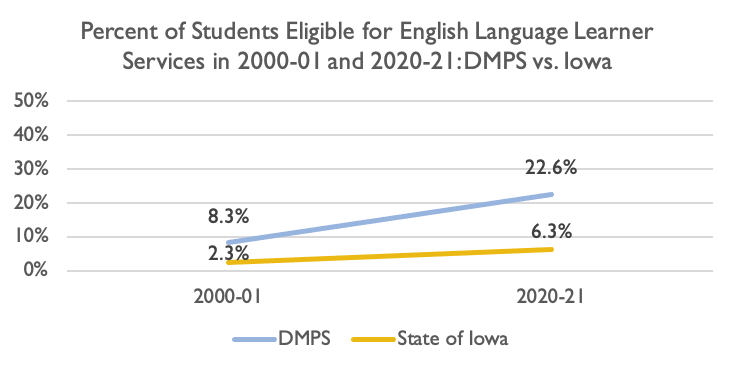
The number of English language learner (ELL) students has steadily increased at DMPS. In the past 20 years, the ELL population at DMPS has almost tripled. Currently, ELL students represent 22.6 percent of DMPS students. DMPS educates nearly 7,000 ELL students in grades K-12.
COMPARISON WITH STATE OF IOWA
Over the past 20 years, student race/ethnicity demographics have changed for both DMPS and the state of Iowa. However, the rates of change have differed drastically. The state of Iowa currently has a higher percentage of white students than DMPS had 20 years ago. In 2000-01, the difference in the percent of white students between the state of Iowa and DMPS was 18.9. In 2020-21, this difference is 38%.
One out of every five Black/African-American public school students in Iowa attend DMPS. Three out of every 20 Hispanic/Latinx public school students in Iowa attend DMPS.
Trends in differences between DMPS and the state of Iowa in percent of students eligible for free or reduced priced meals mirrors trends in percent of students who are non-white. In 2000-01, the difference in percent of students eligible for free or reduced priced meals between the state of Iowa and DMPS was 18.3. In 2020-21, this difference is 34.2%. DMPS represents six percent of the state of Iowa’s PK-12 public school student population, yet 12 percent of students eligible for free or reduced priced meals and 22 percent of ELL students.
DMPS is ranked 10th in the state of Iowa with regard to our overall percentage of ELL students. However, the total number of ELL students at DMPS is greater than the total number students enrolled at 96 percent of Iowa districts.